web » Browser Performance Metrics
Description
As of v2.7, Nexial supports the capturing of browser performance metrics during an execution. These metrics correspond to the browser’s activities to handle the response from the server and the performance thereof. This is sometimes referred to as “Client-side Performance Metrics”, which is different than the “Server-side Performance Metrics”. The server-side performance testing, often done through performance testing tools like JMeter or Gatling, focuses mainly on the responsiveness and resilience of the web server or web application over varying concurrent request load. Client-side performance testing, on the other hand, focuses on the user experience through the vantage point of the client application. Both types of performance metrics are important and in isolation neither tells the complete story on application performance.
Performance matters! Using a slower application is almost always a worse user experience than a faster one (all other things being equal). When analyzed alongside server-side performance metrics, one gains the right perspective in terms of user experience, bottlenecks and optimization opportunity.
In terms of browser performance metrics (just metrics hereafter), there are general 3 categories of data we can gather (excerpt from A Primer for Web Performance Timing API):
The exact metrics exposed via this API can be found in the MDN web docs. The amount of timing and events being tracked through this API can be overwhelming and possibly confusing. To streamline the metrics collection and to simplify analysis, Nexial implemented a series of simpler data points via System variables. The image below depicts the mapping between Nexial supported metrics and W3C's timing events. Click on the image below to open a larger version on a separate tab.

| System variable | Description |
|---|---|
nexial.web.metrics.TTFB |
The time, in milliseconds, between the start of user's request to the browser and when the corresponding response is initially received by the browser. |
nexial.web.metrics.TTLB |
The time, in milliseconds, between the start of user's request to the browser and the completion of the corresponding response received (downloaded) by the browser. |
nexial.web.metrics.BackendTime |
Same as nexial.web.metrics.TTLB. |
nexial.web.metrics.DomInteractive |
The time, in milliseconds, between the start of user's request to the browser and the requested page ready for user interaction (while the same page might not be completely loaded). |
nexial.web.metrics.PageCompleteTime |
The time, in milliseconds, between the start of user's request to the browser and the requested page being completely loaded, parsed and all sub-resources loaded. |
nexial.web.metrics.Latency |
The time incurred, in millisecond by the browser loading requested data from its cache, or the time between the browser issuing the request and the corresponding response first received from the server. |
nexial.web.metrics.NetworkOverhead |
The time incurred, in milliseconds, to complete DNS lookup and open TCP connection by the browser. |
nexial.web.metrics.FirstResponseTime |
The time, in millisecond, to receive initial response since the request was made. |
nexial.web.metrics.ContentDownload |
The time, in milliseconds, between the browser receiving the first and the last byte of the corresponding response. |
nexial.web.metrics.DomContentLoaded |
The time, in milliseconds, between receiving the last byte of the response (which subsequently start the
parsing of the response thereof) and the document in question being loaded completely. To be considered as "loaded completely", the browser would perform the following activities:
|
nexial.web.metrics.FirstInteractive |
The time, in milliseconds, to parse the DOM, CSSOM and accessibility objects. |
nexial.web.metrics.PageReady |
The time, in milliseconds, to load the DOM, CSSOM and accessibility objects parsed from the received content, and to parse any deferred scripts. |
nexial.web.metrics.OnLoad |
The time, in millisecond, taken to executed all the JavaScript load events after the corresponding page is completely loaded. |
This API that allows you to collect lifecycle timing information related to resources in a document. It enables one to measure user latency, which is crucial to benchmark web pages. Using the Resource Timing API allows us to retrieve and analyze a detailed profile of all the network timing data for every resource on the page. As such we can use this API to track the performance of the resources of our page, and determine how many and what resources we have to optimize.
[more to come...]
- Is it happening? (FP)
- Is this useful? (FCP)
[more to come...]
What does it look like?
When metrics collection is enabled, Nexial will gather the metrics along the way during the execution. When the
execution is completed, the metrics is transformed into a HTML file - browser-metrics.html - a “dashboard” of sorts,
and placed in the output directory. It looks as follows
(subject to changes):
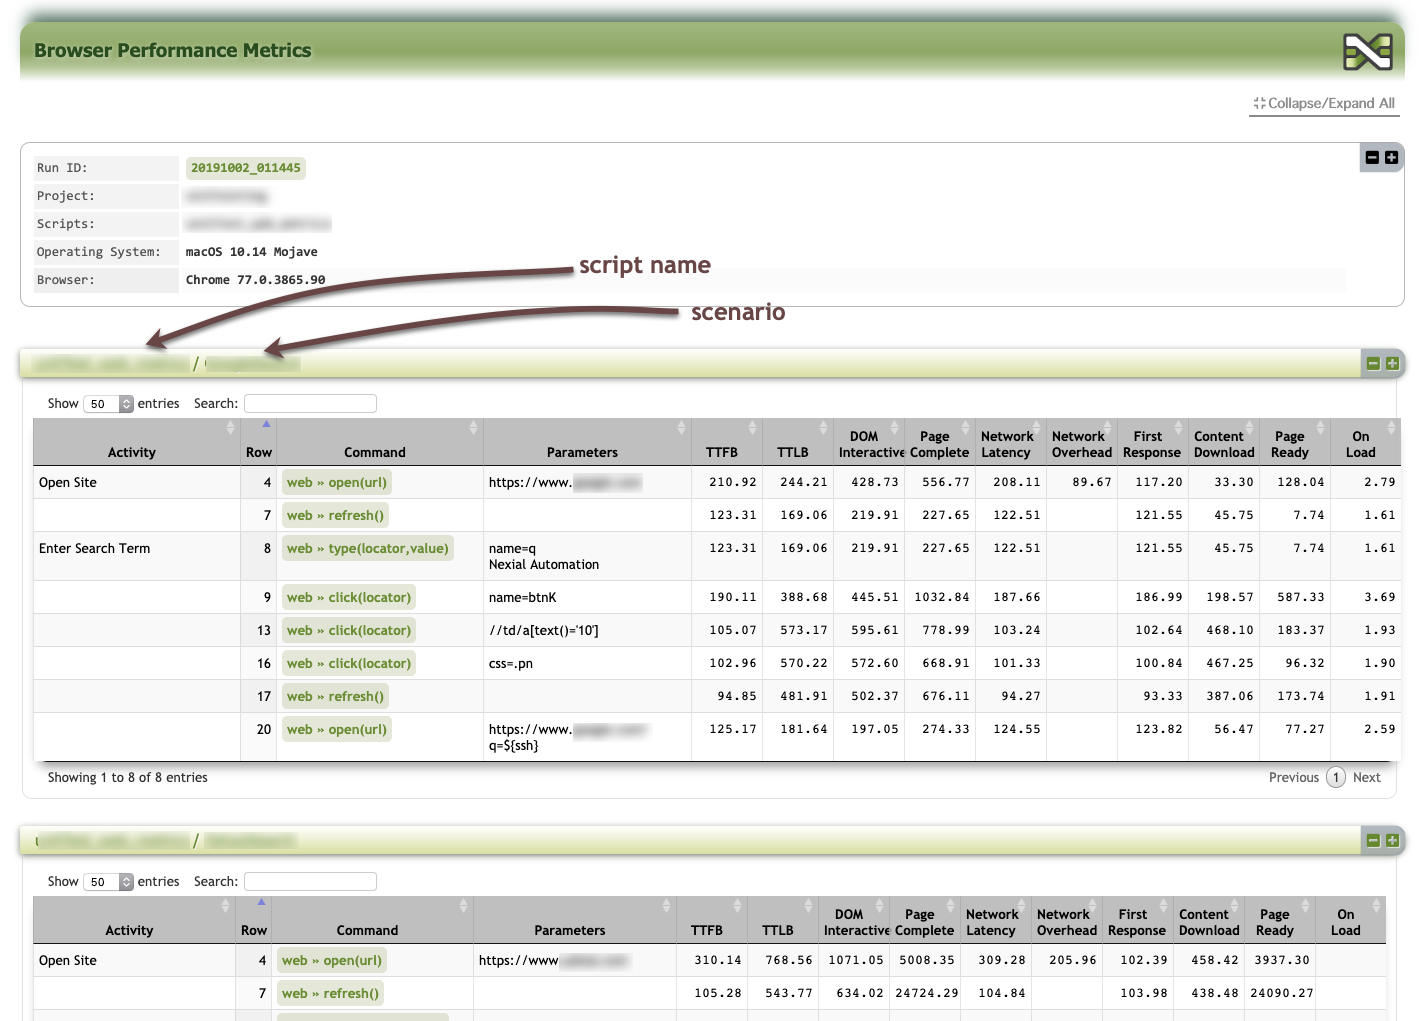
The metrics is separated by the corresponding script/scenario into an interactive grid structure equipped with search and sort capabilities. One can use the metrics presented in these grids to analyze the browser performance when it was used during automation.
Future version of the metrics dashboard will include charts and historical comparison. Stay tuned!
How do I get started?
Here are the steps to follow to enable metrics collection:
- Add the System variable
nexial.web.metrics.enabledand set its value totrue. - Add the desired metrics by the associated System variable names and set them to
true. These System variables can be found in the Navigation Timing. For example,
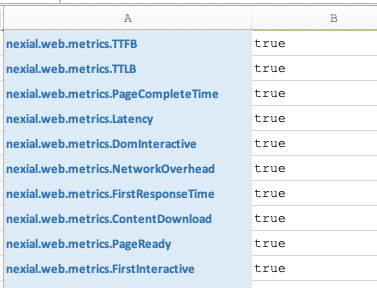
- That’s it! Nexial will collect the specified metrics on the “action” Web commands (i.e. not
assert...orvalidatecommands).